We built a deliberately large synthetic vSphere inventory and ran the real API and UI against it. That was the point of the test: find the slow path ourselves, not after an operator opens an estate with tens of thousands of VMs.
01 / The slow path
The prepared query picked a bad plan.
The datastore filter used a correlated EXISTS query on the VM
disk table. PostgreSQL starts a parameterised prepared statement with five
custom plans, then compares their average estimated cost with a generic plan.
In our test it chose the generic plan for the sixth request, lost the useful
parameter estimate and did one disk lookup for every visible VM. That request
took 8.7 seconds.
We found a second issue in the vCenter filter. It converted an indexed UUID column to text. That version measured 408 ms p50 and 469 ms p95.
02 / What changed
Two small query changes fixed it.
The API now parses the vCenter ID once and compares it directly with the indexed UUID column, while invalid IDs stop at the API with HTTP 400.
The datastore filter now builds one set of matching VM IDs and joins it with the inventory. The disk lookup happens once, not once per visible VM.
We could have forced custom plans or changed the pgx execution mode. We didn't. The query now stays fast with the normal statement cache, including after PostgreSQL chooses a generic plan.
03 / Measurements
The datastore filter measured 183 ms p95.
This was the API speed test. It used 50,000 synthetic VM records, 102,732 disk records and 14,919 migration records. Each query ran once for warm-up and 15 times for measurement.
The combined cluster and datastore filter was faster because it matched a
smaller set of VMs. The last page was slower because it still used
OFFSET pagination.
We also ran an inventory sync while one and then two operators used the API. The worst p95 was 394 ms. There were no errors, timeouts or database lock stalls.
04 / Browser checks
Then we used the screen, not only the API.
This larger test started with 60,000 synthetic VM records across four vCenters. It marked 9,072 records as stale, so the UI showed 50,928 VMs. We tested vCenter, cluster and datastore filters, paging and VM selection.
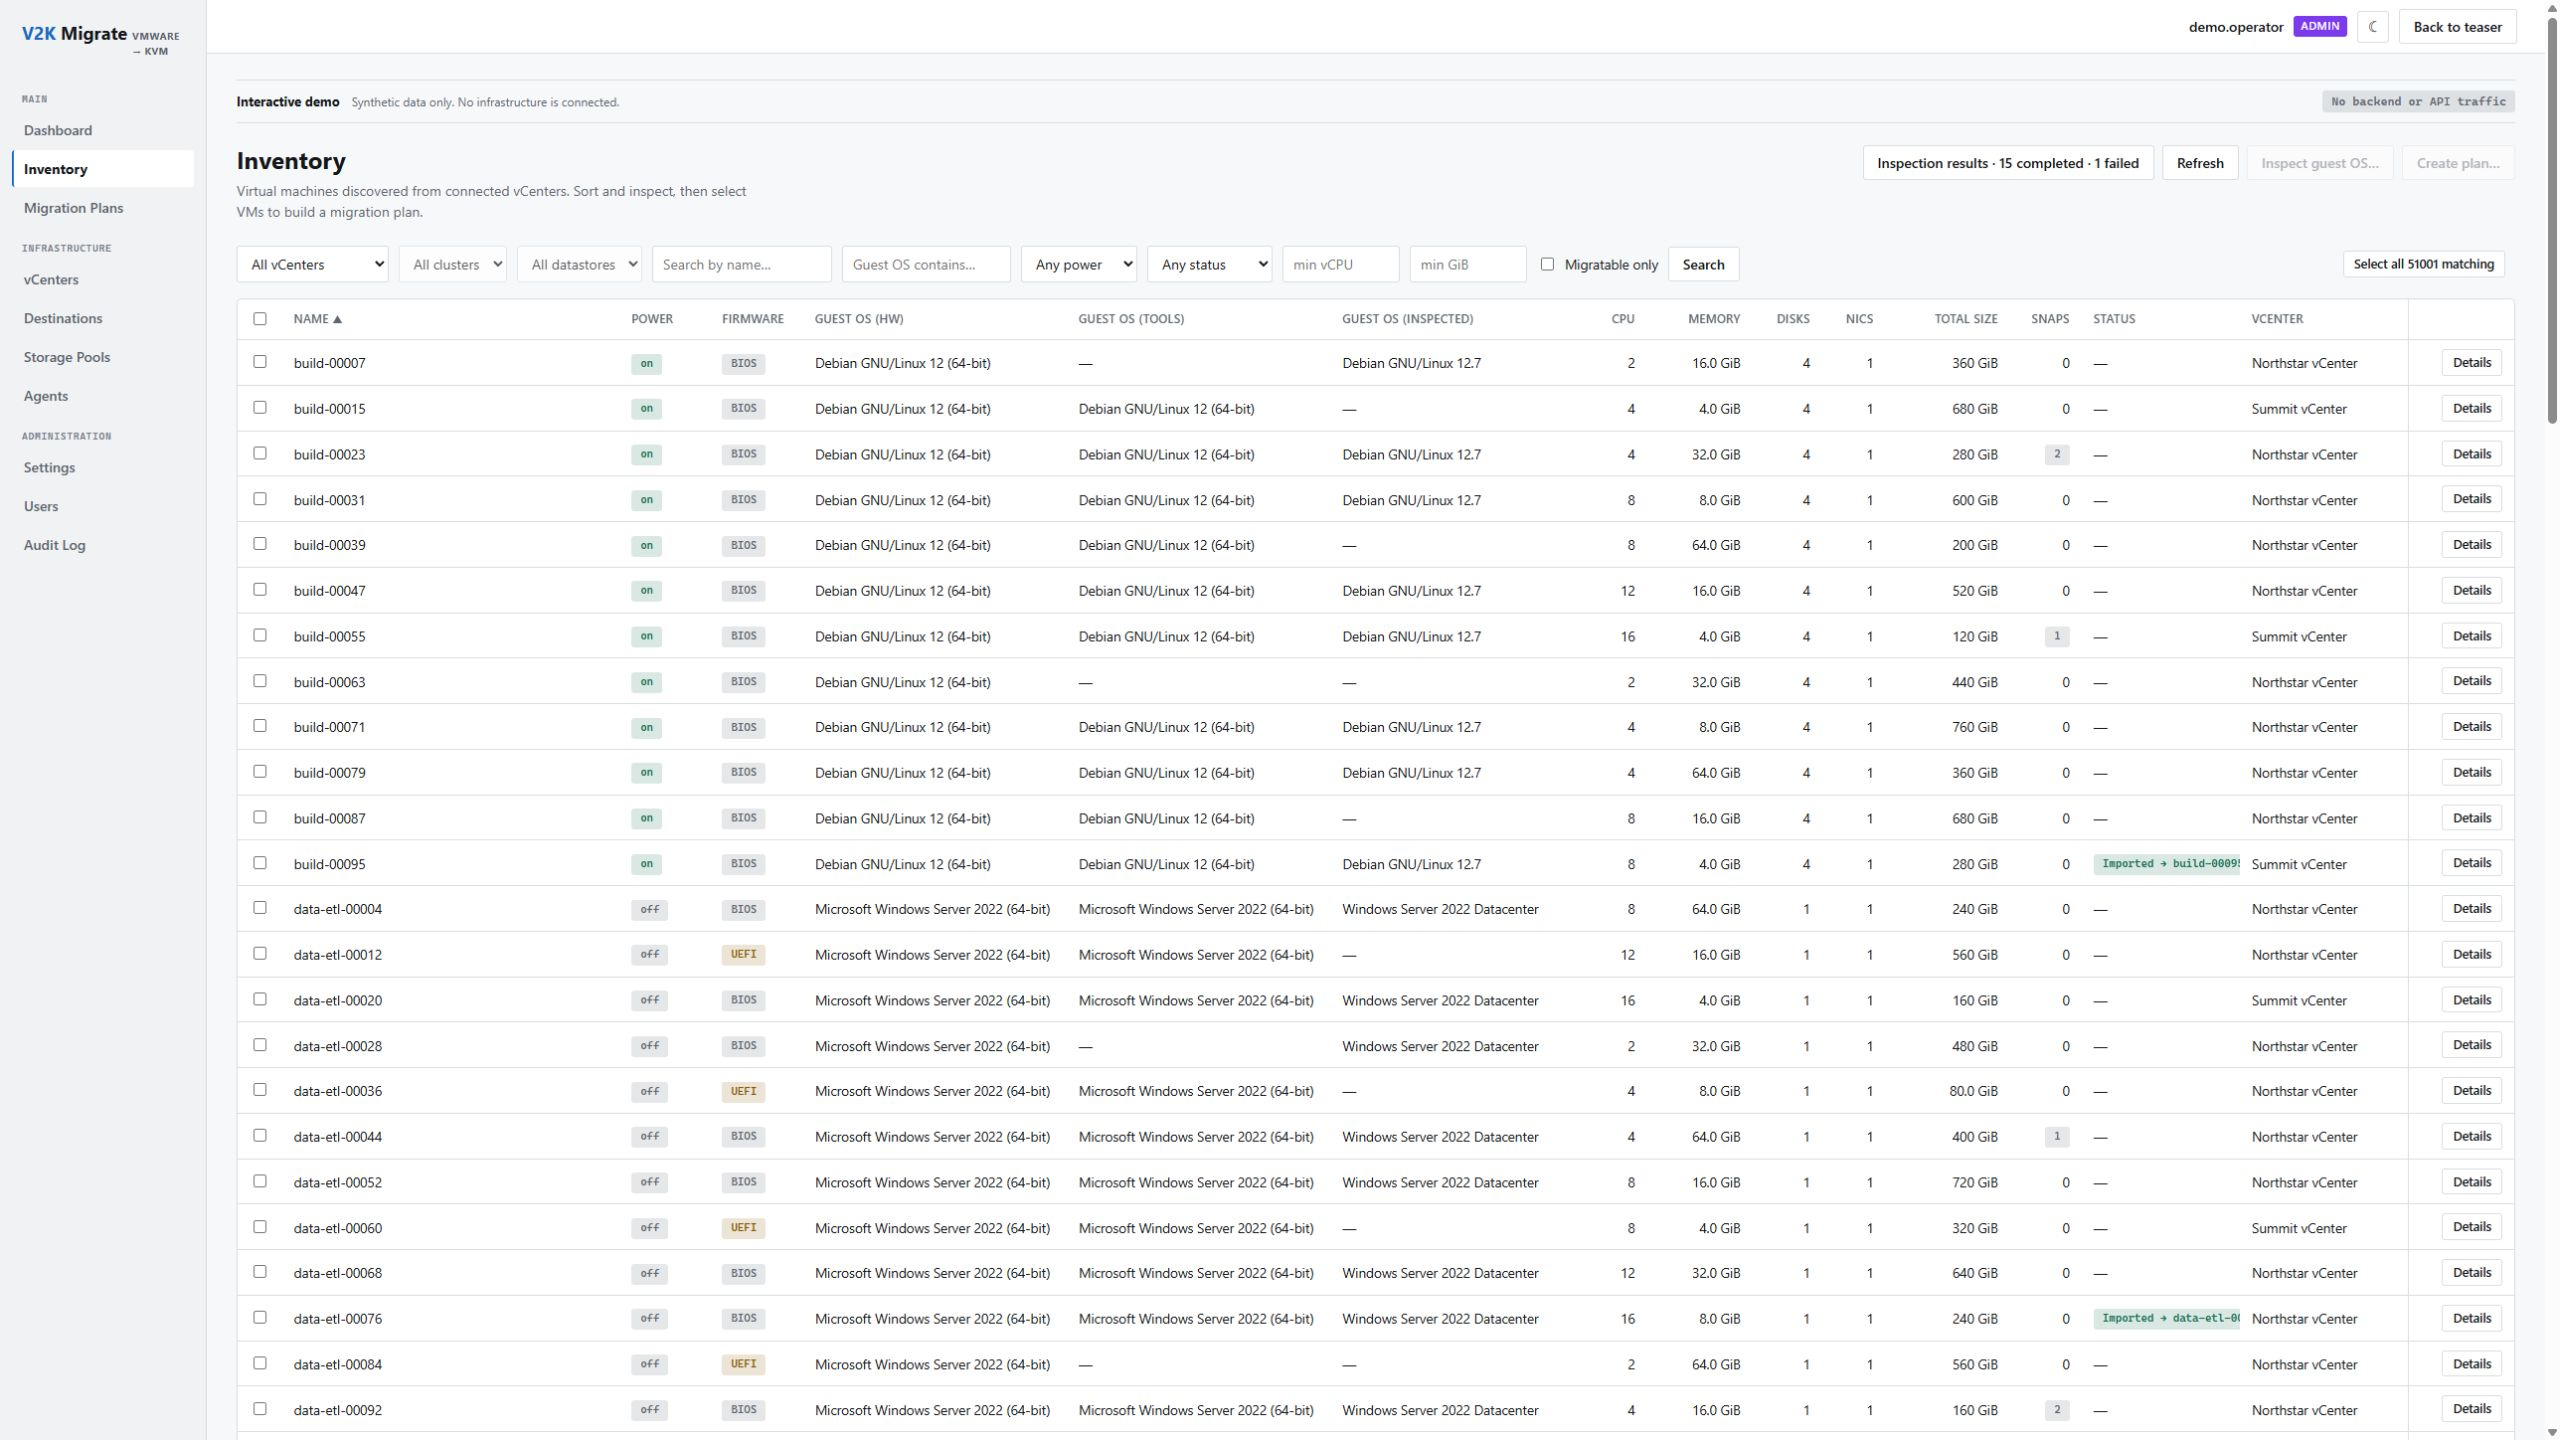
This found two UI bugs. Select all stopped at 5,000 VMs, but the button did not say so. It does now. A note about the old selection could also remain after the selection changed. We now clear it immediately.
05 / What we tested
What we did, and what we didn't do.
We used a disposable PostgreSQL 16 database. We did not connect to a vCenter with 50,000 real VMs or run 50,000 migrations.
The test tool creates related VM, disk, cluster, datastore and migration records. A small database would not have shown this problem.
We checked the database, API and real UI together. We tested filters, paging, VM selection and creation of a migration plan. This was a control-plane test, not a migration-throughput test.